

Most clients don't read a 30-page SEO report. They open it, see a wall of charts, and ask the same question: "So, are we getting more calls?" If your local SEO reporting can't answer that in under a minute, it isn't doing its job. We build monthly reports for Orange County small businesses, and the ones that get read are always the simplest.
Here is the short answer. A strong local SEO report tracks five things: local keyword rankings, Google Business Profile insights, citations, reviews, and website traffic by location. Then it ties each number to a business result, like phone calls, direction requests, or form leads. Metrics without that link are just decoration.
Below, you'll learn which metrics matter and which to skip, how to set up each section step by step, and how to explain changes in plain language. We also cover reporting tools and templates that cut the work from hours to minutes, so you can deliver a clear report every month without dreading it.
Why local SEO reports need their own approach
Local SEO is not general SEO with a city name added. A plumber in Santa Ana competes for a map pack spot, not just a blue link, so how to rank in Google Maps matters more than a blue link, and the customer who finds them is often ready to call within minutes. Your report has to reflect that, which is why local SEO reporting needs its own structure.
Local results follow different rules
Google says local results depend on relevance, distance, and prominence. Distance is the factor that changes your reporting. Two searchers in Irvine and Tustin, just a few miles apart, can see different top three results for the same query. A single "we rank #3" number is misleading, so you need to track rankings by location.
Conversions also happen off your website. Many customers tap Call or Get Directions straight from the listing and never visit the site. Google Analytics shows none of that, so Google Business Profile performance data is the only record of those actions.
How local and general reports differ
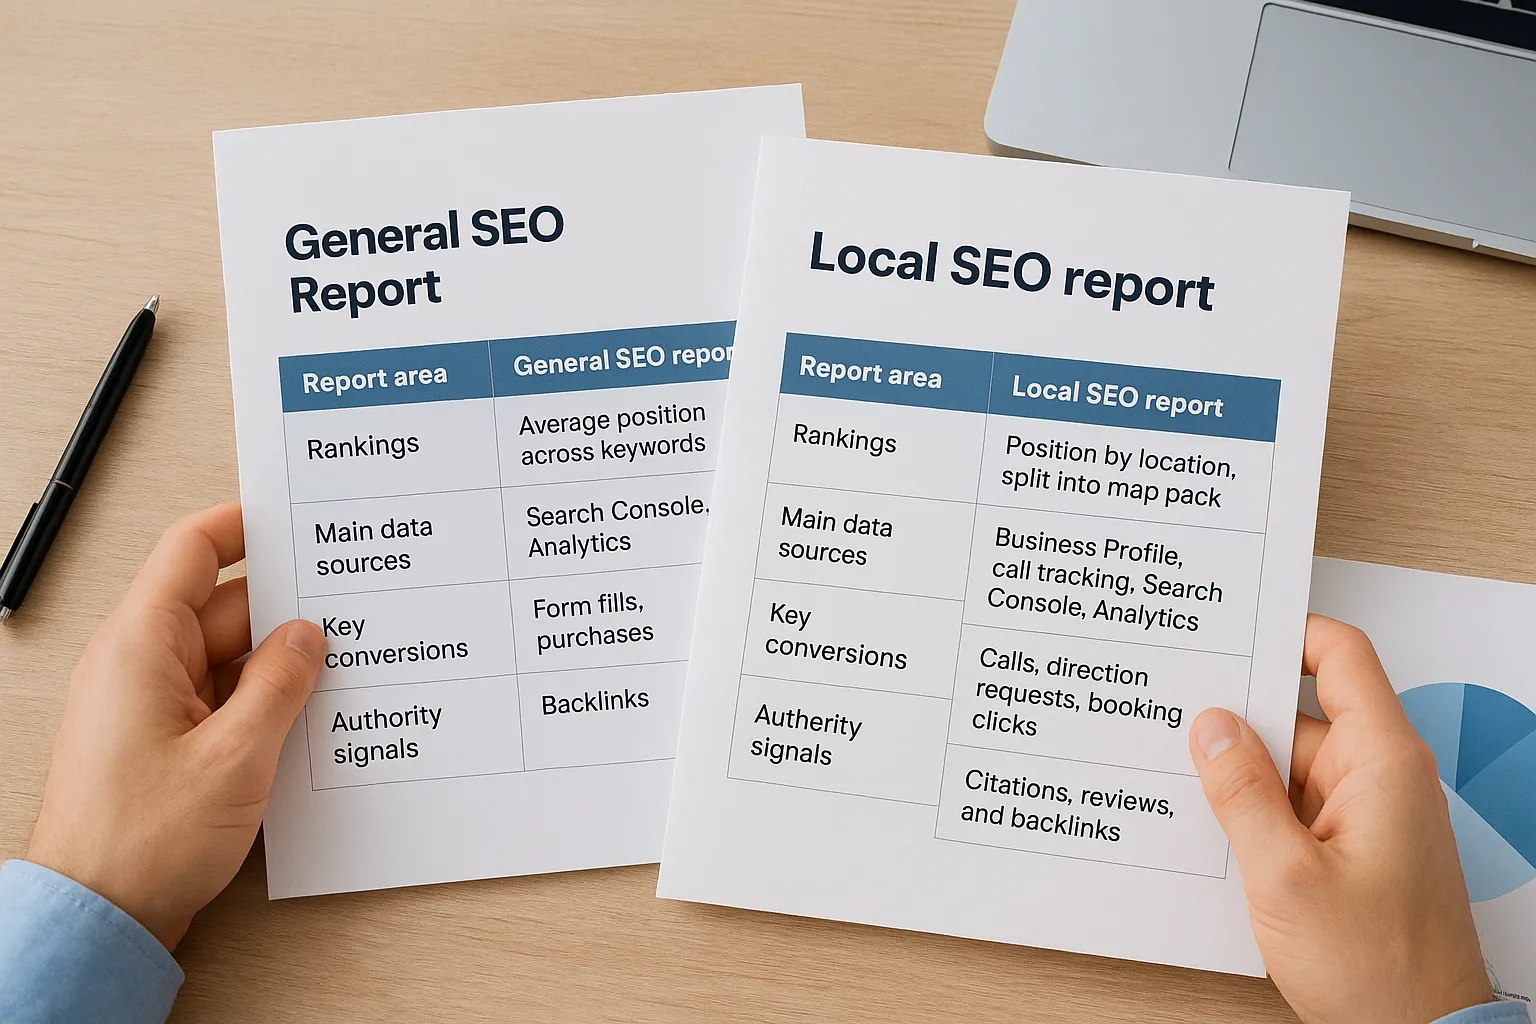
The table below shows where the two reports part ways. If your current template looks like the middle column, it needs work.
| Report area | General SEO report | Local SEO report |
|---|---|---|
| Rankings | Average position across keywords | Position by location, split into map pack and organic |
| Main data sources | Search Console, Analytics | Business Profile, call tracking, Search Console, Analytics |
| Key conversions | Form fills, purchases | Calls, direction requests, booking clicks |
| Authority signals | Backlinks | Citations, reviews, and backlinks |
| Geography | Site-wide or national | City, neighborhood, service area |
Mistakes that make local reports useless
Most weak reports fail in one of three ways:
- They report one ranking. The number comes from a single search on the agency's own computer, which tells the client almost nothing about how customers see them.
- They bury the result. Forty metrics sit on one page and the call count is on page 18.
- They ignore reviews. Review count, rating, and response rate shape your local rankings and whether a searcher picks you.
Fixing these is mostly a matter of deciding what the client cares about before you open a single dashboard. A dentist wants booked appointments. A window company wants quote requests from Newport Beach homeowners. Build the report around that one outcome, then show the supporting numbers underneath.
A local SEO report earns its keep when every number connects to a call, a visit, or a lead.
The next four steps show you how to build that kind of report, starting with goals and a schedule.
Step 1. Set goals and a reporting schedule
Every good report starts before you pull any data. Sit down with the client for 15 minutes and ask one question: what does a good month look like? Local SEO reporting works best when you settle that answer first, because it decides which numbers go on page one.
Turn the client's goal into a number
Vague goals like "more visibility" can't be reported on. Convert them into a specific target with a baseline. Pull the last three months of calls, direction requests, and leads so you know where the client starts. Then set a target they can picture.
| Business | Goal | Primary metric |
|---|---|---|
| Dental office in Irvine | 10 more new patient bookings a month | Booking clicks and calls from Business Profile |
| Window company in Newport Beach | 15 quote requests a month | Form submissions from organic and map traffic |
| Tax preparer in Santa Ana | More calls during tax season | Calls from January to April vs. last year |
Agree on the goal in writing, and every later report becomes a progress check instead of a debate.
Choose a schedule that fits the work
Monthly is the right default. Rankings and Business Profile data move slowly, so weekly client reports mostly show noise, while quarterly ones let problems sit too long. Use a three-layer rhythm instead:
- Weekly (internal only): a quick check for ranking drops, new reviews, and listing edits you didn't make.
- Monthly (client report): one to three pages, sent on the same day each month, such as the 5th, once the data is final.
- Quarterly (review call): 30 minutes on trends, seasonality, and next quarter's targets.
Put the send date in your onboarding notes. Consistency builds trust faster than any chart, and a client who knows the report lands on the 5th stops emailing on the 20th to ask how things are going.
Step 2. Choose the metrics that matter
Pick every metric by asking one question: does this number change what the client does next? Start with five core metrics and add more only when a goal demands it. A tight list keeps your local SEO reporting short enough to get read.
The five core metrics
Each metric below maps to a stage of the customer's path, from seeing the listing to picking up the phone. Track all five every month so trends are easy to compare.
| Metric | What to track | What it tells the client |
|---|---|---|
| Local rankings | Map pack and organic position for 10 to 15 keywords, by city or grid point | Whether customers in each area can find them |
| Business Profile insights | Calls, direction requests, website clicks, bookings | Actions taken straight from the listing |
| Citations | Total listings, plus the share with matching name, address, and phone details | Whether directories agree on the business details |
| Reviews | New reviews, average rating, response rate | Trust with searchers and strength for rankings |
| Traffic by location | Organic sessions and leads by city | Which service areas actually produce business |
Open the report with calls and direction requests, then show rankings as the explanation. Rankings are a cause. Calls are the result, and the client cares about the result.
Lead with the result the client wants, then show the rankings that explain it.
Metrics to leave out
Skip numbers that look impressive and prove little. Total impressions, third-party domain authority scores, and raw keyword counts rarely help a window company decide anything. If a client asks for them, put them in an appendix.
Set a hard limit as well. Keep page one to eight or ten numbers, each compared with last month and with the same month last year. Seasonal businesses like tax preparers need that year-over-year view, because a drop in July can be perfectly normal.
Step 3. Pull data from the right sources
Once you know your metrics, you need to know where each one lives. Pull a number from the wrong place and it won't match the client's own records, which kills trust fast. Good local SEO reporting depends on one trusted source per metric.
Match each metric to its source
| Metric | Source | Where to find it |
|---|---|---|
| Calls, directions, website clicks, bookings | Google Business Profile | Performance section of the profile |
| Organic sessions and leads by city | Google Analytics 4 | City report, filtered to organic search |
| Search queries and location page clicks | Search Console | Performance report, filtered by page |
| Map pack and organic rankings | Geo-grid rank tracker | Same keywords and grid points each month |
| Calls from the website | Call tracking | Call log by source |
| Citations and reviews | Listing audit, Business Profile | Accuracy check, Reviews tab |
Use one source per metric and one definition per month, and your numbers will never contradict each other.
Export on the same day every month
Data changes daily, so pull everything in one sitting. Follow the same sequence each time:
- Open Business Profile Performance, set the full previous month, and record calls, directions, website clicks, and bookings.
- In Search Console, compare that month with the same month last year for your location pages, using regex filters for local queries to isolate the searches that matter.
- In Google Analytics 4, filter to organic search and note sessions and key events for each target city.
- Run your rank tracker with the same keywords and grid points, so changes reflect rankings and not a new setup.
- Paste everything into one data sheet with a month column.
Know the gaps before the client does
Search Console doesn't report by city, so use city-level location pages as a stand-in. A page for Tustin that gains clicks tells you more than a site-wide average. Analytics city data also comes from IP addresses, so treat it as a good estimate, not an exact count.
Business Profile numbers can lag by a few days at month's end. That's one more reason to send the report on the 5th and not the 1st.
Step 4. Build the report and explain the results
With your data sheet finished, the last step is turning it into something a client can read in two minutes. Layout matters more than design here. Keep your local SEO reporting to one to three pages, and use the same structure every month so clients always know where to look.
Follow a fixed page order
Open with the answer and put the detail behind it. A fixed page order saves you time to build and saves the client time to read. Use this sequence:

- Summary: three sentences on what changed, why, and what happens next.
- Scorecard: the eight to ten numbers from Step 2, with month-over-month and year-over-year change.
- Rankings: grid map screenshots, this month beside last month.
- Work completed: reviews answered, listings fixed, pages updated.
- Next month: two or three planned actions.
Explain every change in plain language
A number without a reason invites worry. For each major move, write what happened, the likely cause, and what you'll do about it. Skip terms like "SERP volatility" and say what the owner would say. Here is a summary you can copy and adapt:
This month: Calls from Google rose from 42 to 51 (+21%).
Why: Our Tustin service page moved into the top three on the map grid.
Watch: Direction requests dipped 8%, likely from seasonal travel.
Next: We'll add 10 new photos and reply to every open review.
Every number in your report needs a reason and a next step, or it's just noise.
Bad news belongs in the report too. Flag drops early and pair them with a fix, because a client who hears about a problem from you stays calm, and one who finds it alone starts doubting the whole campaign. Then close with next month's actions, so the report ends on a plan and not a pile of charts.
Local SEO report templates and tool options
You don't need to build every report from scratch. A reusable template plus two or three local SEO reporting tools turns a three-hour job into a 30-minute one. The point of tooling in local SEO reporting is to automate the data pull, not the thinking.
Start with a free dashboard template
Google's free Looker Studio connects to Analytics 4 and Search Console, and it can pull in Business Profile data through its connectors. Build the Step 4 layout once, then duplicate it for each client and swap the data sources. Your page order never changes, so clients learn where to look.
A bare-bones template needs only these blocks:
Page 1: Summary (3 sentences) + scorecard (8-10 numbers)
Page 2: Grid map rankings, this month vs. last month
Page 3: Work completed + next month's actions
Appendix: Citations list, full review log, extra metrics
Match each job to a tool
Free sources cover most of the data. Paid tools fill the gaps that Google doesn't report, mainly grid-based rankings and audits of the directory listings behind your citations.
| Job | What to look for | Example tools |
|---|---|---|
| Dashboard | Free, scheduled email delivery | Looker Studio |
| Map pack rankings | Geo-grid maps by keyword | Local Falcon, BrightLocal |
| Citation audit | Flags wrong name, address, phone | Whitespark, BrightLocal |
| Call tracking | Call logs by source | CallRail |
Choose tools that fit your client count
With one to three clients, stick to the free stack and a single grid tracker. Manual exports take minutes at that size. Once you pass five or ten clients, white-label reporting and scheduled sends start to pay for themselves.
Whatever you buy, run a test on one real client before you commit. Check that the numbers match Business Profile and that the grid uses your keywords and locations. Tools also shift pricing and features often, so confirm current details on each vendor's site.
Automate the data pull, but write the summary yourself, because the explanation is what clients actually pay for.
Putting your reporting into practice
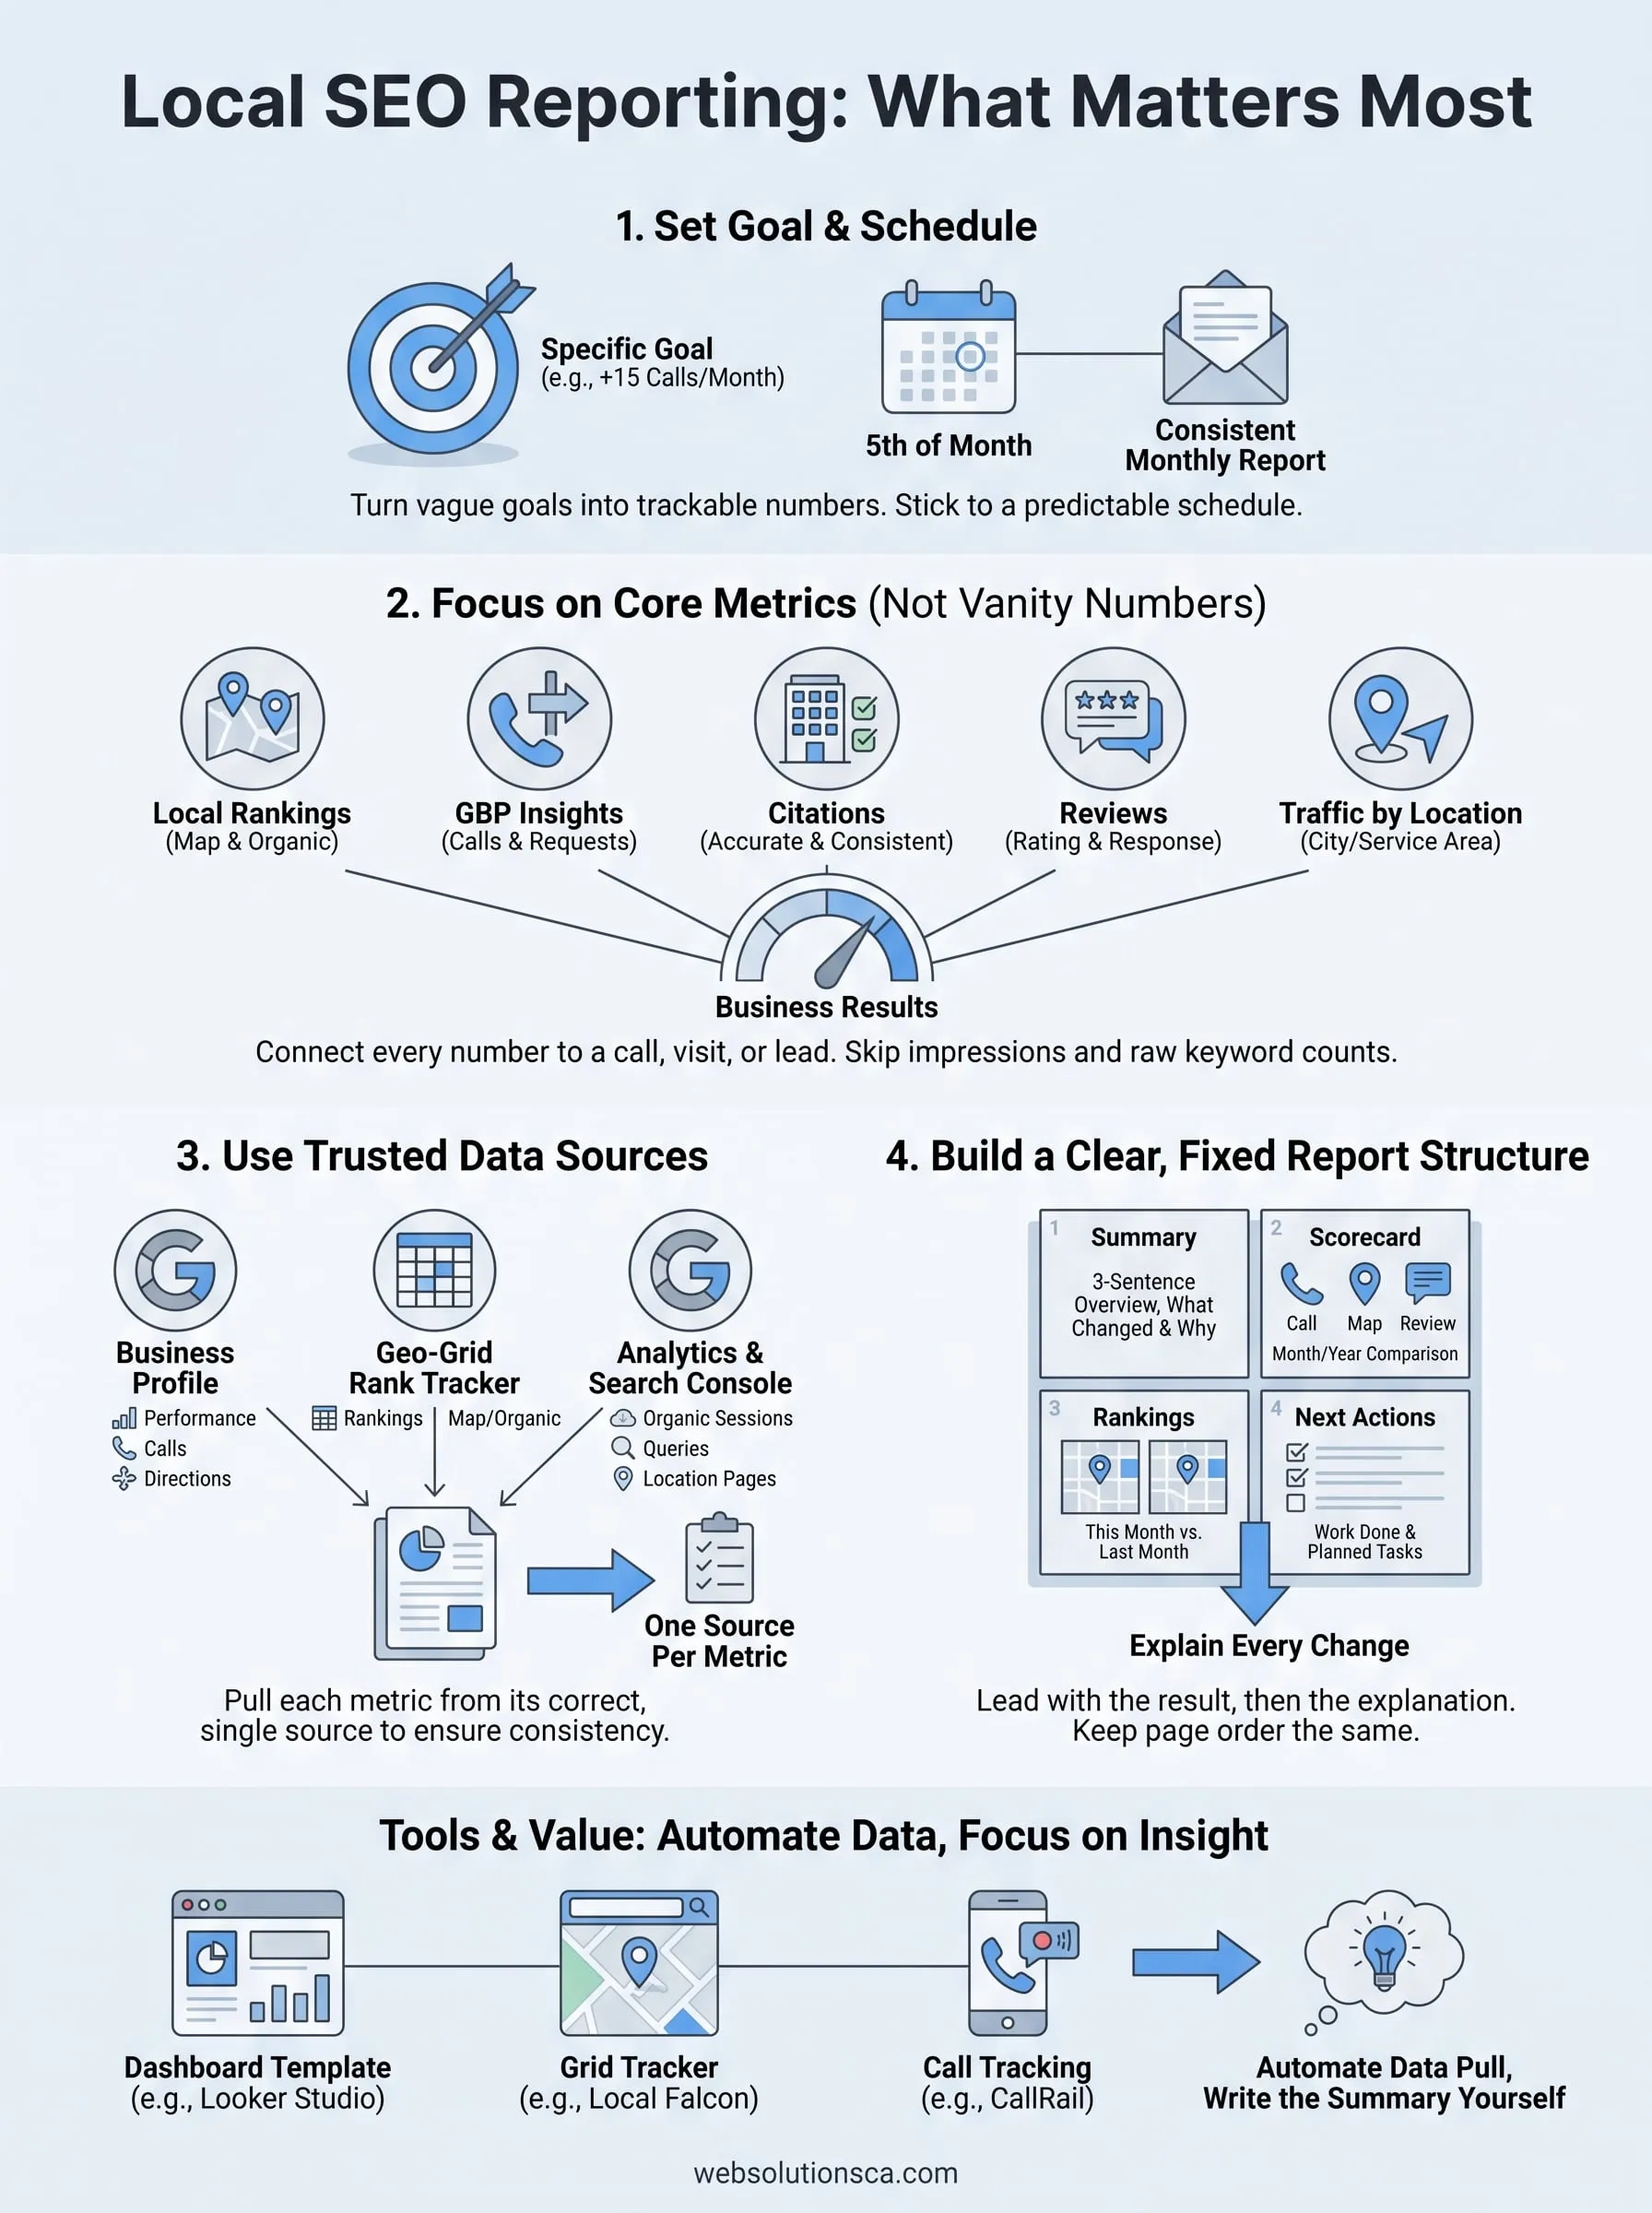
Good local SEO reporting comes down to a repeatable habit. Set one goal with a baseline, track the five core metrics, pull each number from a single source, and explain every change in plain language. Do that on the same day each month, and your reports stay short, accurate, and easy to trust.
Start small. Build one template in Looker Studio, run it for one client, and refine it after the first month. Clients don't need more charts. They need to see that calls, directions, and leads are moving, and they need to know what happens next.
If you'd rather hand the work off, Web Solutions CA can help. We handle Google Business Profile optimization and monthly reporting for Orange County small businesses. Talk to our team about local SEO services in Orange County and get a report you'll actually look forward to opening.